Benchmark of Blob Storage vs Redis Cache Latency using Application insights

When using Azure Event Hub in an application, checkpointing is key to ensure reliability and consistency.
**Checkpoints allow consumer applications to track which events they've already processed**, preventing duplicate processing and data loss, as we saw in a [previous post.](https://blog.techdominator.com/article/azure-event-hubs-checkpoints-and-rewinding.html)
By default, Azure Event Hubs SDKs [use Azure Blob Storage for storing these checkpoints.](https://blog.techdominator.com/article/consuming-messages-with-azure-event-hubs.html) It's durable and easy to set up, but as with many storage solutions, latency can become a bottleneck especially in high-throughput or low-latency scenarios.
In ['Azure Event Hubs Consumer Client'](https://blog.techdominator.com/article/azure-event-hubs-consumer-client.html), we also saw that with specialized event consumption clients, it was possible to **use alternative checkpoint stores such as Redis;** an in-memory data store known for its lightning-fast performance but also characterized by some volatility.
In this post, we'll compare latency performance between Blob Storage and Redis Cache when used for Event Hub checkpointing; by exploring our sample that uses [Azure Functions](https://learn.microsoft.com/en-us/azure/azure-functions/functions-overview) and [Application Insights](https://learn.microsoft.com/en-us/azure/azure-monitor/app/app-insights-overview) to observe the latency in the Azure environment.
**Full working sample** [is available on Github as usual](https://github.com/MissaouiChedy/BlogSamples/tree/main/AzureEventHubsBlobCheckpointLatency)
## Set Up for Latency Measurement
### Infrastructure
This post's sample uses an **Azure Function** to make 1 write operation on each of a **Redis Cache** key and a **Storage Blob's** metadata. Write operations are instrumented with **Application Insights** configured on the Azure function:
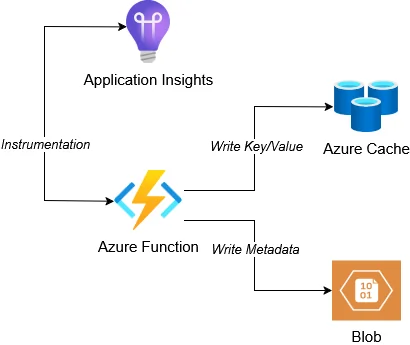
In this situation, we used an Azure function to measure latency when the application workload **runs on the same Azure region** as the checkpoint store.
Elaborating on Azure Functions and Application insights is beyond the scope of this post, however keep in mind that **Azure Function is the easiest compute service to setup.**
Application Insights is easy to integrate with Azure Function and provides the [application dependency map](https://learn.microsoft.com/en-us/azure/azure-monitor/app/app-map?tabs=net) feature that **displays call latency averages for applications dependency,** when the application is instrumented, as we are going to see in the next section.
### Function Implementation
Let's take a look at the Azure Function Implementation:
```csharp
[Function("MainLatencyMeasurementFunction")]
public async Task Run(
[HttpTrigger(AuthorizationLevel.Function, "post")]
HttpRequest req)
{
...
var blobClient = container.GetBlobClient("0");
var blobDependencyTelemetry = new DependencyTelemetry
{
Name = "Azure Blob Storage",
Type = "Azure Blob",
Target = StorageAccountName,
Data = $"checkpoint/0"
};
await CallWithDependencyTracking(() =>
{
return blobClient.SetMetadataAsync(new Dictionary
{
{ "touched", DateTime.UtcNow.ToString() }
});
}, blobDependencyTelemetry);
...
var cache = connectionMultiplexer.GetDatabase();
var redisDependencyTelemetry = new DependencyTelemetry
{
Name = "Redis Cache",
Type = "Redis",
Target = RedisCacheName,
Data = "last-touched"
};
await CallWithDependencyTracking(() =>
{
return cache.StringSetAsync("last-touched", DateTime.UtcNow.ToString());
}, redisDependencyTelemetry);
return new OkObjectResult($"Operation Done {DateTime.UtcNow}");
}
```
The `MainLatencyMeasurementFunction.Run` method id the entry point of the function. It performs essentially the following steps:
1. Initialize the `blobClient` Blob Client and Writes a metadata key
1. Initialize the `cache` redis Client and Writes a key/value in the cache
Here we have to notice 2 points regarding app insights instrumentation:
- Before each call, we create a `DependencyTelemetry` object containing information about the dependency we are about to call
- Calls to the dependencies are wrapped with the `CallWithDependencyTracking` method
The previous two steps are necessary to report metrics to applications insights.
Taking a look at the `CallWithDependencyTracking` method:
```csharp
private async Task CallWithDependencyTracking(
Func action, DependencyTelemetry dependencyTelemetry)
{
dependencyTelemetry.Timestamp = DateTime.UtcNow;
using (var operation = _telemetryClient.StartOperation(dependencyTelemetry))
{
try
{
await action();
}
catch (Exception ex)
{
operation.Telemetry.Success = false;
_telemetryClient.TrackException(ex);
throw;
}
finally
{
_telemetryClient.StopOperation(operation);
_telemetryClient.Flush();
}
}
}
```
The wrapper method uses the app insight's SDK `TelemetryClient` to Start and Stop an operation with the provided `DependencyTelemetry` object.
The responsibility of this method is to execute `action` passed as argument and to capture metrics related to it, **here we are mostly interested by operation duration.**
## Invoking the function and Visualizing Metrics
The [`Invoke-MainFunction.ps1`](https://github.com/MissaouiChedy/BlogSamples/blob/main/AzureEventHubsBlobCheckpointLatency/Invoke-MainFunction.ps1) powershell script can be used to invoke the functions Http trigger multiple times.
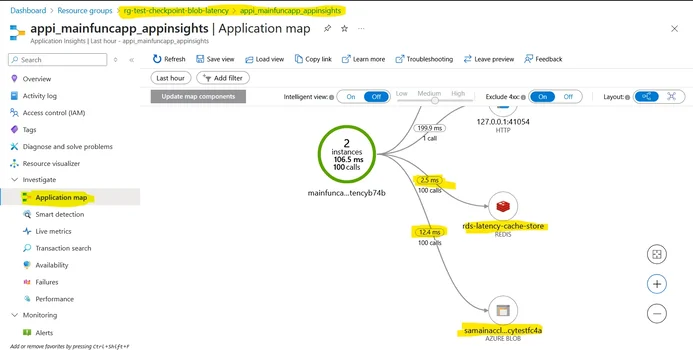
After invoking the script with the default `$CallCount=100`, we can then visualize the application map displaying average latency for each dependency:
## Blob Storage not so bad
Azure Blob Storage typically delivers checkpoint write latencies in the lower tens of milliseconds, **often ranging between 10–20 ms under normal load.**
In contrast, Redis Cache offers ultra-low latencies, often clocking in **under 5 milliseconds for write operations.**
While the difference remains significant for heavy workloads, in my opinion, **it's not that big of a difference for most workloads.**
Moreover, when you factor in Blob Storage’s durability with its built-in persistence and replication it becomes a solid choice for storing checkpoints and ownership data. And since checkpointing is typically done every few events rather than on each one, **the slightly higher latency is rarely a bottleneck** in well-designed workloads.
## Closing Thoughts
After some benchmarking, it is now clear why the [`EventProcessorClient`](https://blog.techdominator.com/article/consuming-messages-with-azure-event-hubs.html) uses Blob Storage by default:
- Durable
- Reliable
- Good Enough Read/Write performance