outline
Sponsored by

Blob Checkpoint Latency, So Bad ?
Benchmark of Blob Storage vs Redis Cache Latency using Application insights

When using Azure Event Hub in an application, checkpointing is key to ensure reliability and consistency.
Checkpoints allow consumer applications to track which events they’ve already processed, preventing duplicate processing and data loss, as we saw in a previous post.
By default, Azure Event Hubs SDKs use Azure Blob Storage for storing these checkpoints. It’s durable and easy to set up, but as with many storage solutions, latency can become a bottleneck especially in high-throughput or low-latency scenarios.
In ‘Azure Event Hubs Consumer Client’, we also saw that with specialized event consumption clients, it was possible to use alternative checkpoint stores such as Redis; an in-memory data store known for its lightning-fast performance but also characterized by some volatility.
In this post, we’ll compare latency performance between Blob Storage and Redis Cache when used for Event Hub checkpointing; by exploring our sample that uses Azure Functions and Application Insights to observe the latency in the Azure environment.
Full working sample is available on Github as usual
Set Up for Latency Measurement
Infrastructure
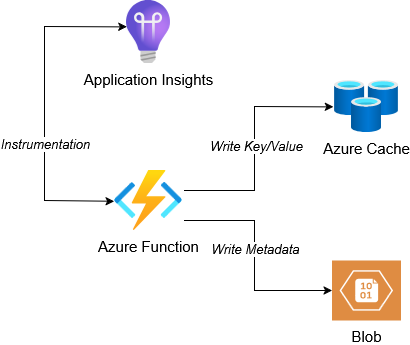
This post’s sample uses an Azure Function to make 1 write operation on each of a Redis Cache key and a Storage Blob’s metadata. Write operations are instrumented with Application Insights configured on the Azure function:
In this situation, we used an Azure function to measure latency when the application workload runs on the same Azure region as the checkpoint store.
Elaborating on Azure Functions and Application insights is beyond the scope of this post, however keep in mind that Azure Function is the easiest compute service to setup.
Application Insights is easy to integrate with Azure Function and provides the application dependency map feature that displays call latency averages for applications dependency, when the application is instrumented, as we are going to see in the next section.
Function Implementation
Let’s take a look at the Azure Function Implementation:
[Function("MainLatencyMeasurementFunction")]
public async Task<IActionResult> Run(
    [HttpTrigger(AuthorizationLevel.Function, "post")]
    HttpRequest req)
{
    ...
    var blobClient = container.GetBlobClient("0");

    var blobDependencyTelemetry = new DependencyTelemetry
    {
        Name = "Azure Blob Storage",
        Type = "Azure Blob",
        Target = StorageAccountName,
        Data = $"checkpoint/0"
    };

    await CallWithDependencyTracking(() =>
    {
        return blobClient.SetMetadataAsync(new Dictionary<string, string>
        {
            { "touched", DateTime.UtcNow.ToString() }
        });
    }, blobDependencyTelemetry);
    ...
    var cache = connectionMultiplexer.GetDatabase();

    var redisDependencyTelemetry = new DependencyTelemetry
    {
        Name = "Redis Cache",
        Type = "Redis",
        Target = RedisCacheName,
        Data = "last-touched"
    };

    await CallWithDependencyTracking(() =>
    {
        return cache.StringSetAsync("last-touched", DateTime.UtcNow.ToString());
    }, redisDependencyTelemetry);

    return new OkObjectResult($"Operation Done {DateTime.UtcNow}");
}
The MainLatencyMeasurementFunction.Run method id the entry point of the function. It performs essentially the following steps:
- Initialize the
blobClientBlob Client and Writes a metadata key - Initialize the
cacheredis Client and Writes a key/value in the cache
Here we have to notice 2 points regarding app insights instrumentation:
- Before each call, we create a
DependencyTelemetryobject containing information about the dependency we are about to call - Calls to the dependencies are wrapped with the
CallWithDependencyTrackingmethod
The previous two steps are necessary to report metrics to applications insights.
Taking a look at the CallWithDependencyTracking method:
private async Task CallWithDependencyTracking(
    Func<Task> action, DependencyTelemetry dependencyTelemetry)
{
    dependencyTelemetry.Timestamp = DateTime.UtcNow;
    using (var operation = _telemetryClient.StartOperation(dependencyTelemetry))
    {
        try
        {
            await action();
        }
        catch (Exception ex)
        {
            operation.Telemetry.Success = false;
            _telemetryClient.TrackException(ex);
            throw;
        }
        finally
        {
            _telemetryClient.StopOperation(operation);
            _telemetryClient.Flush();
        }
    }
}
The wrapper method uses the app insight’s SDK TelemetryClient to Start and Stop an operation with the provided DependencyTelemetry object.
The responsibility of this method is to execute action passed as argument and to capture metrics related to it, here we are mostly interested by operation duration.
Invoking the function and Visualizing Metrics
The Invoke-MainFunction.ps1 powershell script can be used to invoke the functions Http trigger multiple times.
After invoking the script with the default $CallCount=100, we can then visualize the application map displaying average latency for each dependency:
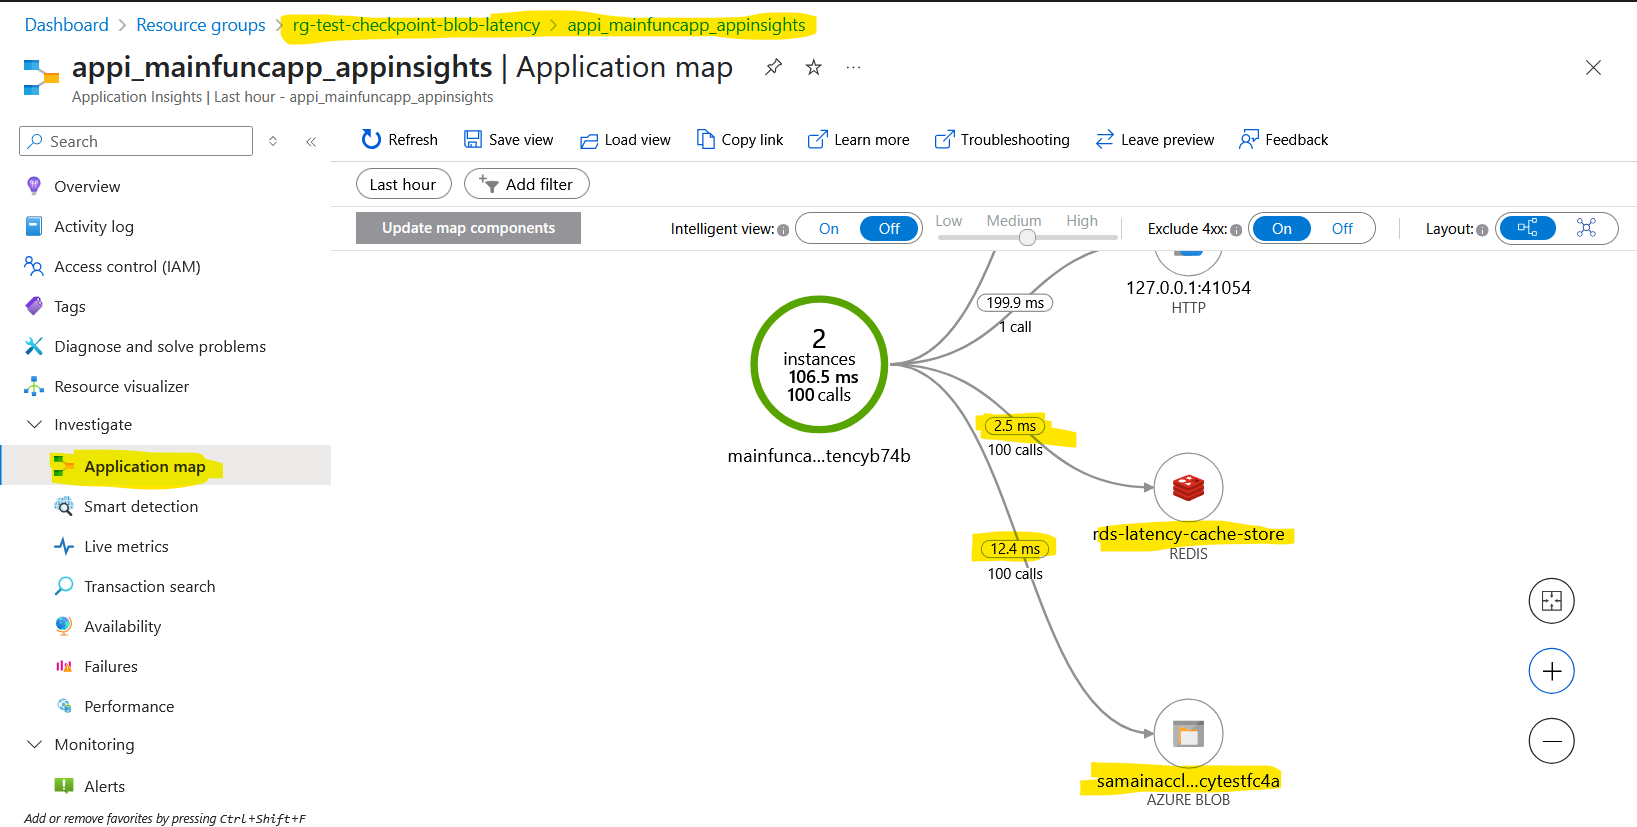
Blob Storage not so bad
Azure Blob Storage typically delivers checkpoint write latencies in the lower tens of milliseconds, often ranging between 10–20 ms under normal load.
In contrast, Redis Cache offers ultra-low latencies, often clocking in under 5 milliseconds for write operations.
While the difference remains significant for heavy workloads, in my opinion, it’s not that big of a difference for most workloads.
Moreover, when you factor in Blob Storage’s durability with its built-in persistence and replication it becomes a solid choice for storing checkpoints and ownership data. And since checkpointing is typically done every few events rather than on each one, the slightly higher latency is rarely a bottleneck in well-designed workloads.
Closing Thoughts
After some benchmarking, it is now clear why the EventProcessorClient uses Blob Storage by default:
- Durable
- Reliable
- Good Enough Read/Write performance