
Load Testing Event Hubs Processing With Locust
Discussion of how to use Azure Load to load test Event Hubs triggered Azure Function using Locust and Application Insights for Server Side Metrics.
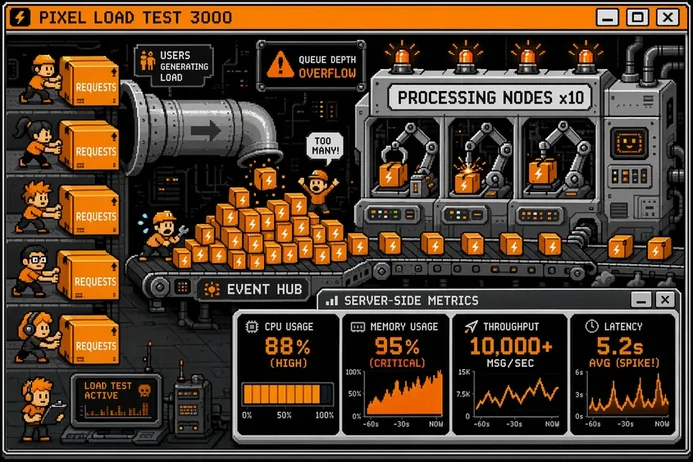
Load testing a request/response API is straightforward: send the request, wait for the response, and the response time already tells you most of what you need to know about the system’s performances.
Event driven, asynchronous processing pipelines are not so straightforward. The producer gets an acknowledgment as soon as the event lands in the broker, well before any real work occurs on the consumer side, so the client side response time is not a useful performance signal.
In this post, we go through how to load test an asynchronous Azure Event Hubs based event processing process with Locust, how to instrument the consumer side with custom Application Insights metrics such as event processing lead time and cycle time, and how to run the whole thing at scale with Azure Load Testing.
Full working sample is available on Github as usual.
Challenges With Load Testing Async Event Processing
With a synchronous, request/response API, load testing is fairly self contained. A virtual user sends a request, the tool measures how long it takes to get a response back, and that duration is already a decent proxy for how the system behaves under load.
This is not the case for asynchronous APIs. When a producer sends an event to Azure Event Hubs, it typically gets an acknowledgment almost immediately, that ack only confirms the event was accepted by the broker, not that it was fully processed.
The actual work, deserializing the payload, enriching it, persisting it, happens later, on a different process, at a pace dictated by the consumer’s own throughput.
This means the interesting numbers live on the server side, and getting to them requires the consuming application to be instrumented on purpose to produce valuable metrics.
Standard telemetry collected by platforms like Application Insights (requests, dependencies, exceptions…) is built around the request/response shape and doesn’t capture concepts such as “how long did this event wait before being picked up” or “how long did it take to process once picked up”.
It is worth mentioning that some sidecar based middlewares take a different approach to this problem. Dapr’s pub/sub building block, for example, flips the asynchronism around: the application exposes HTTP POST resources that gets called by the sidecar when an event is received. This unifies instrumentation on top of the request/response model that most Observability tools already understands well.
This distinction lines up with how Azure Load Testing separates client side metrics from server side metrics.
Client side metrics (response time, throughput, error rate) are collected by the load test engine and describe the experience of the caller.
Server side metrics are collected from the system under test itself, CPU, memory, queue depth, or in our case, custom metrics emitted by the consuming application. For an asynchronous processing process, server side metrics carry most of the interesting numbers.
Later in this post, we will focus on two of those server side metrics in detail: event processing lead time and event processing cycle time.
Load Testing With Locust
Locust is the tool we use in our sample to generate load.
It’s Python based, defines load scenarios as plain Python code rather than XML or a proprietary DSL.
Locust Basics
A Locust scenario is called a locustfile, it’s a .py file that Locust discovers and runs. Its most important building blocks are:
- A User class,
HttpUserfor REST APIs or the more genericUserfor anything else, that represents one simulated virtual user. - One or more methods decorated with
@task, representing the pieces of behaviour a virtual user repeatedly executes. - A
wait_timebetween task executions, used to shape the traffic pattern instead of hammering the system as fast as possible. - Optional
on_startandon_stophooks, run once per virtual user when it spawns and stops, useful for setting up and tearing down any per-user state.
Locust’s threading model is built on gevent rather than OS threads. Each virtual user runs as a lightweight greenlet, and greenlets cooperatively yield control whenever they hit an I/O bound operation.
This is what allows a single Locust process to simulate a large number of concurrent users without paying the cost of one OS thread per user, provided the workload stays I/O bound, which sending events over the network typically is.
Worth to mention that Locust has also been building a next generation,
asynciobased runtime as of this writing. It’s a promising direction for I/O heavy scenarios like ours, but it isn’t fully supported by Azure Load Testing yet, so the sample sticks to the classic gevent basedUserAPI.
When we start a run, we choose a target user count and a spawn rate, Locust ramps virtual users up to the target at that rate, and each one loops through its tasks with the configured wait time until the run stops.
Locust And Azure Event Hubs
Sending events to Event Hubs from a Locust task means using the Event Hubs Python SDK directly inside the task body, there is no built-in Event Hubs sampler like there would be for HTTP.
Under LoadTests/main_load_test.py, the sample defines an EventHubUser extending Locust’s generic User class:
class EventHubUser(User):
    """A virtual user that streams events to the Event Hub."""

    wait_time = between(0.1, 0.5)

    def on_start(self) -> None:
        # Each virtual user gets its own credential + producer client.
        self._credential = DefaultAzureCredential()
        self._producer = EventHubProducerClient(
            fully_qualified_namespace=EVENTHUB_FULLY_QUALIFIED_NAMESPACE,
            eventhub_name=EVENTHUB_NAME,
            credential=self._credential,
        )

    def on_stop(self) -> None:
        try:
            self._producer.close()
        finally:
            self._credential.close()
on_start and on_stop make sure exactly one EventHubProducerClient and one credential are created per virtual user, created once when the user spawns and closed once when it stops.
The send_event task builds an event schema-compliant payload and sends it as a batch using AreaCode as the partition key:
@task
def send_event(self) -> None:
    payload = build_event()
    body = json.dumps(payload)
    start = time.perf_counter()
    exception = None
    try:
        batch = self._producer.create_batch(partition_key=payload["AreaCode"])
        batch.add(EventData(body))
        self._producer.send_batch(batch)
    except Exception as exc:
        # report any failure to Locust
        exception = exc

    # Since Event Hub is asynchronous,
    # we report the time taken to create and send the batch to locust.
    events.request.fire(
        request_type=REQUEST_TYPE,
        name=REQUEST_NAME,
        response_time=(time.perf_counter() - start) * 1000,
        response_length=0,
        exception=exception,
    )
Because there is no HTTP request for Locust to observe automatically, we manually fire an events.request event, timing only the batch creation and the AMQP send (as a client side metric), and forwarding any exception so failed sends show up in the Locust statistics exactly like a failed HTTP call would.
Collecting Custom Metrics With Application Insights
As discussed previously, application should be instrumented to produce server side metrics that are deliberately designed around the event’s lifecycle rather than borrowed from generic telemetry in most cases.
Application Insights supports several metric types, tracked in one of two ways. TrackMetric records a raw value one at a time, useful for ad hoc measurements, but under load it means one outgoing data point per event, multiplying telemetry volume with throughput.
TelemetryClient.GetMetric(...) instead returns a pre-aggregated metric: values tracked with it are aggregated locally (min, max, sum, count) before being sent, which keeps telemetry volume flat regardless of how many events flow through the pipeline. For high throughput event processing, GetMetric is the better default.
The sample’s MetricsTracker class wraps exactly this pattern:
public class MetricsTracker(TelemetryClient telemetryClient)
{
  ...

   private readonly Metric _batchSizeMetric = telemetryClient
       .GetMetric(BatchSizeMetricName);

   private readonly Metric _queueLagMetric = telemetryClient
       .GetMetric(QueueLagMetricName);

   private readonly Metric _eventLeadTimeMetric = telemetryClient
       .GetMetric(EventLeadTimeMetricName, AreaCodeDimensionName);

   private readonly Metric _eventCycleTimeMetric = telemetryClient
       .GetMetric(EventCycleTimeMetricName, AreaCodeDimensionName);

   private readonly Metric _batchDurationMetric = telemetryClient
       .GetMetric(BatchDurationMetricName);

  ...
}
Notice that _eventLeadTimeMetric and _eventCycleTimeMetric are created with an extra dimension, AreaCode. This lets both metrics be sliced per area code later on, without having to emit a separate metric per value.
The five metrics tracked in the sample are:
I invite you to check the sample’s README section on clock skew to be aware of some caveats with the following metrics.
| Metric | Meaning |
|---|---|
AsyncProcessingApp.BatchSize |
Events received in one trigger invocation, a proxy for backlog pressure |
AsyncProcessingApp.QueueLagMilliseconds |
How long an event waited in the hub before being picked up |
AsyncProcessingApp.EventCycleTimeMilliseconds |
The consumer’s own work time per event, excluding queue wait |
AsyncProcessingApp.EventLeadTimeMilliseconds |
The end to end latency, from enqueue to fully processed |
AsyncProcessingApp.BatchDurationMilliseconds |
Wall clock time to process an entire batch |
These metrics are tracked from the AsyncProcessingFunction, an EventHubTrigger azure function bound to an EventData[] batch:
...
var batchStatistics = new BatchProcessingStatistics(events.Length);
batchStatistics.Start();

metricsTracker.TrackBatchSize(batchStatistics.BatchSize);

foreach (var @event in events)
{
    EventProcessingStatistics eventStatistics = new(@event);
    eventStatistics.Start();

    metricsTracker.TrackQueueLagMilliseconds(eventStatistics.GetQueueLagMilliseconds());

    // ... deserialize, enrich, and upload the event ...
    ...
    eventStatistics.Finish();

    metricsTracker.TrackCycleTimeMilliseconds(
        eventStatistics.GetCycleTimeMilliseconds(),
        @event.PartitionKey ?? MainTopicEvent.DefaultAreaCode);

    metricsTracker.TrackLeadTimeMilliseconds(
        eventStatistics.GetLeadTimeMilliseconds(),
        @event.PartitionKey ?? MainTopicEvent.DefaultAreaCode);
}

batchStatistics.Finish();
metricsTracker
    .TrackBatchDurationMilliseconds(batchStatistics.GetBatchDurationMilliseconds());
...
Binding to EventData rather than a deserialized POCO is a deliberate choice here, it gives access to EventData.EnqueuedTime, a timestamp assigned by the Event Hubs service itself. Queue lag and lead time are both calculated against that timestamp, which removes the producer’s own clock from the equation:
public double GetLeadTimeMilliseconds() =>
    _processingEndedAt is { } processingEndedAt && EventEnqueuedTime != default
        ? (processingEndedAt - EventEnqueuedTime).TotalMilliseconds
        : 0;

public double GetQueueLagMilliseconds() =>
    _processingStartedAt is { } processingStartedAt
        ? (processingStartedAt - EventEnqueuedTime).TotalMilliseconds
        : 0;
Batching behaviour itself is tuned through host.json:
"eventHubs": {
  "maxEventBatchSize": 100,
  "prefetchCount": 300,
  "batchCheckpointFrequency": 50,
  "targetUnprocessedEventThreshold": 100
}
targetUnprocessedEventThreshold is worth calling out: on the Flex Consumption plan, the lower this value is, the more aggressively the platform adds instances when the backlog grows, which directly influences how the BatchSize and QueueLagMilliseconds metrics behave under load.
Locust From Azure Load Testing
Running Locust from a single machine locally works fine for iterating on a test plan, but it doesn’t scale well once you need hundreds of virtual users or want the results correlated with your Azure resources.
This is where Azure Load Testing comes in, it’s a managed service that runs your test script (JMeter or Locust) on managed engines, and it brings a few things to the table that are particularly relevant for this kind of async pipeline:
- Consolidated reporting. The service can pull server side metrics from Azure resources, in our case the Application Insights resource behind the function.
- No load engine infrastructure to manage. You upload the test plan and its dependencies (as files), and the service provisions and tears down the engines running the load.
- Generating load from multiple regions, useful when the system under test is expected to receive traffic from geographically distributed producers.
- A few other capabilities worth knowing about but out of scope here, such as private networking support for testing resources that aren’t publicly reachable.
Cost wise, Azure Load Testing bills based on virtual user hours consumed during test runs, rather than by the engine infrastructure itself, so a short but wide test run tends to be cheap, and it’s worth checking current pricing before running large or long lived load tests.
Azure load test provides a solid user experience to manage tests and track test runs:
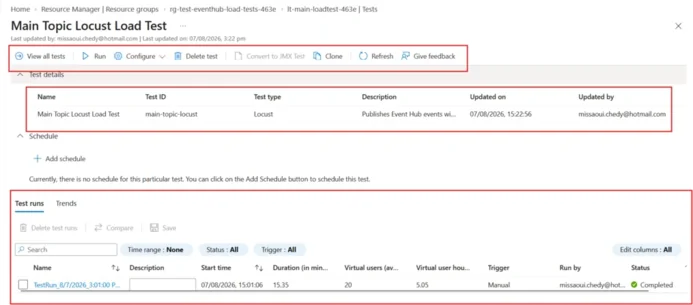
It provides also a solid test run report including all available metrics: client-side, server-side and engine health metrics:
I’d invite you to check out the full sample for the exact scripts and steps: from provisioning the Azure resources with Terraform, to deploying the function, to deploying and running the load test, everything is scripted end to end.
Closing Thoughts
This is very much in the same spirit as a previous post on sending events to Event Hubs with JMeter, Locust is a solid alternative worth having in your toolbox alongside JMeter, particularly if your team already leans towards Python and code-first tooling.
The main advantage of a code based tool like Locust is flexibility: the test plan is plain Python, so anything that can be expressed in code, custom protocols, conditional logic, manual reporting like we did here for the Event Hubs send, is straightforward to implement without fighting a GUI or a plugin ecosystem.
The tradeoff is barrier to entry. A JMeter test plan can be opened, tweaked and understood by a manual tester who doesn’t write code, a Locust script generally can’t.
Which tool is the better fit really depends on who on your team will own the test plans going forward.